THE REAL COST MEASURE IN CALIFORNIA 2021
The Real Cost Measure in the Inland REGION Webinar
February 11, 2022; 11:30 a.m. - 1:00 p.m.
Watch the webinar, download the handouts, and learn more below.

Please review the individual profiles and resources below.
It has been two years since our last Real Cost Measure event. We now return with the release of the Real Cost Measure 2021 report.
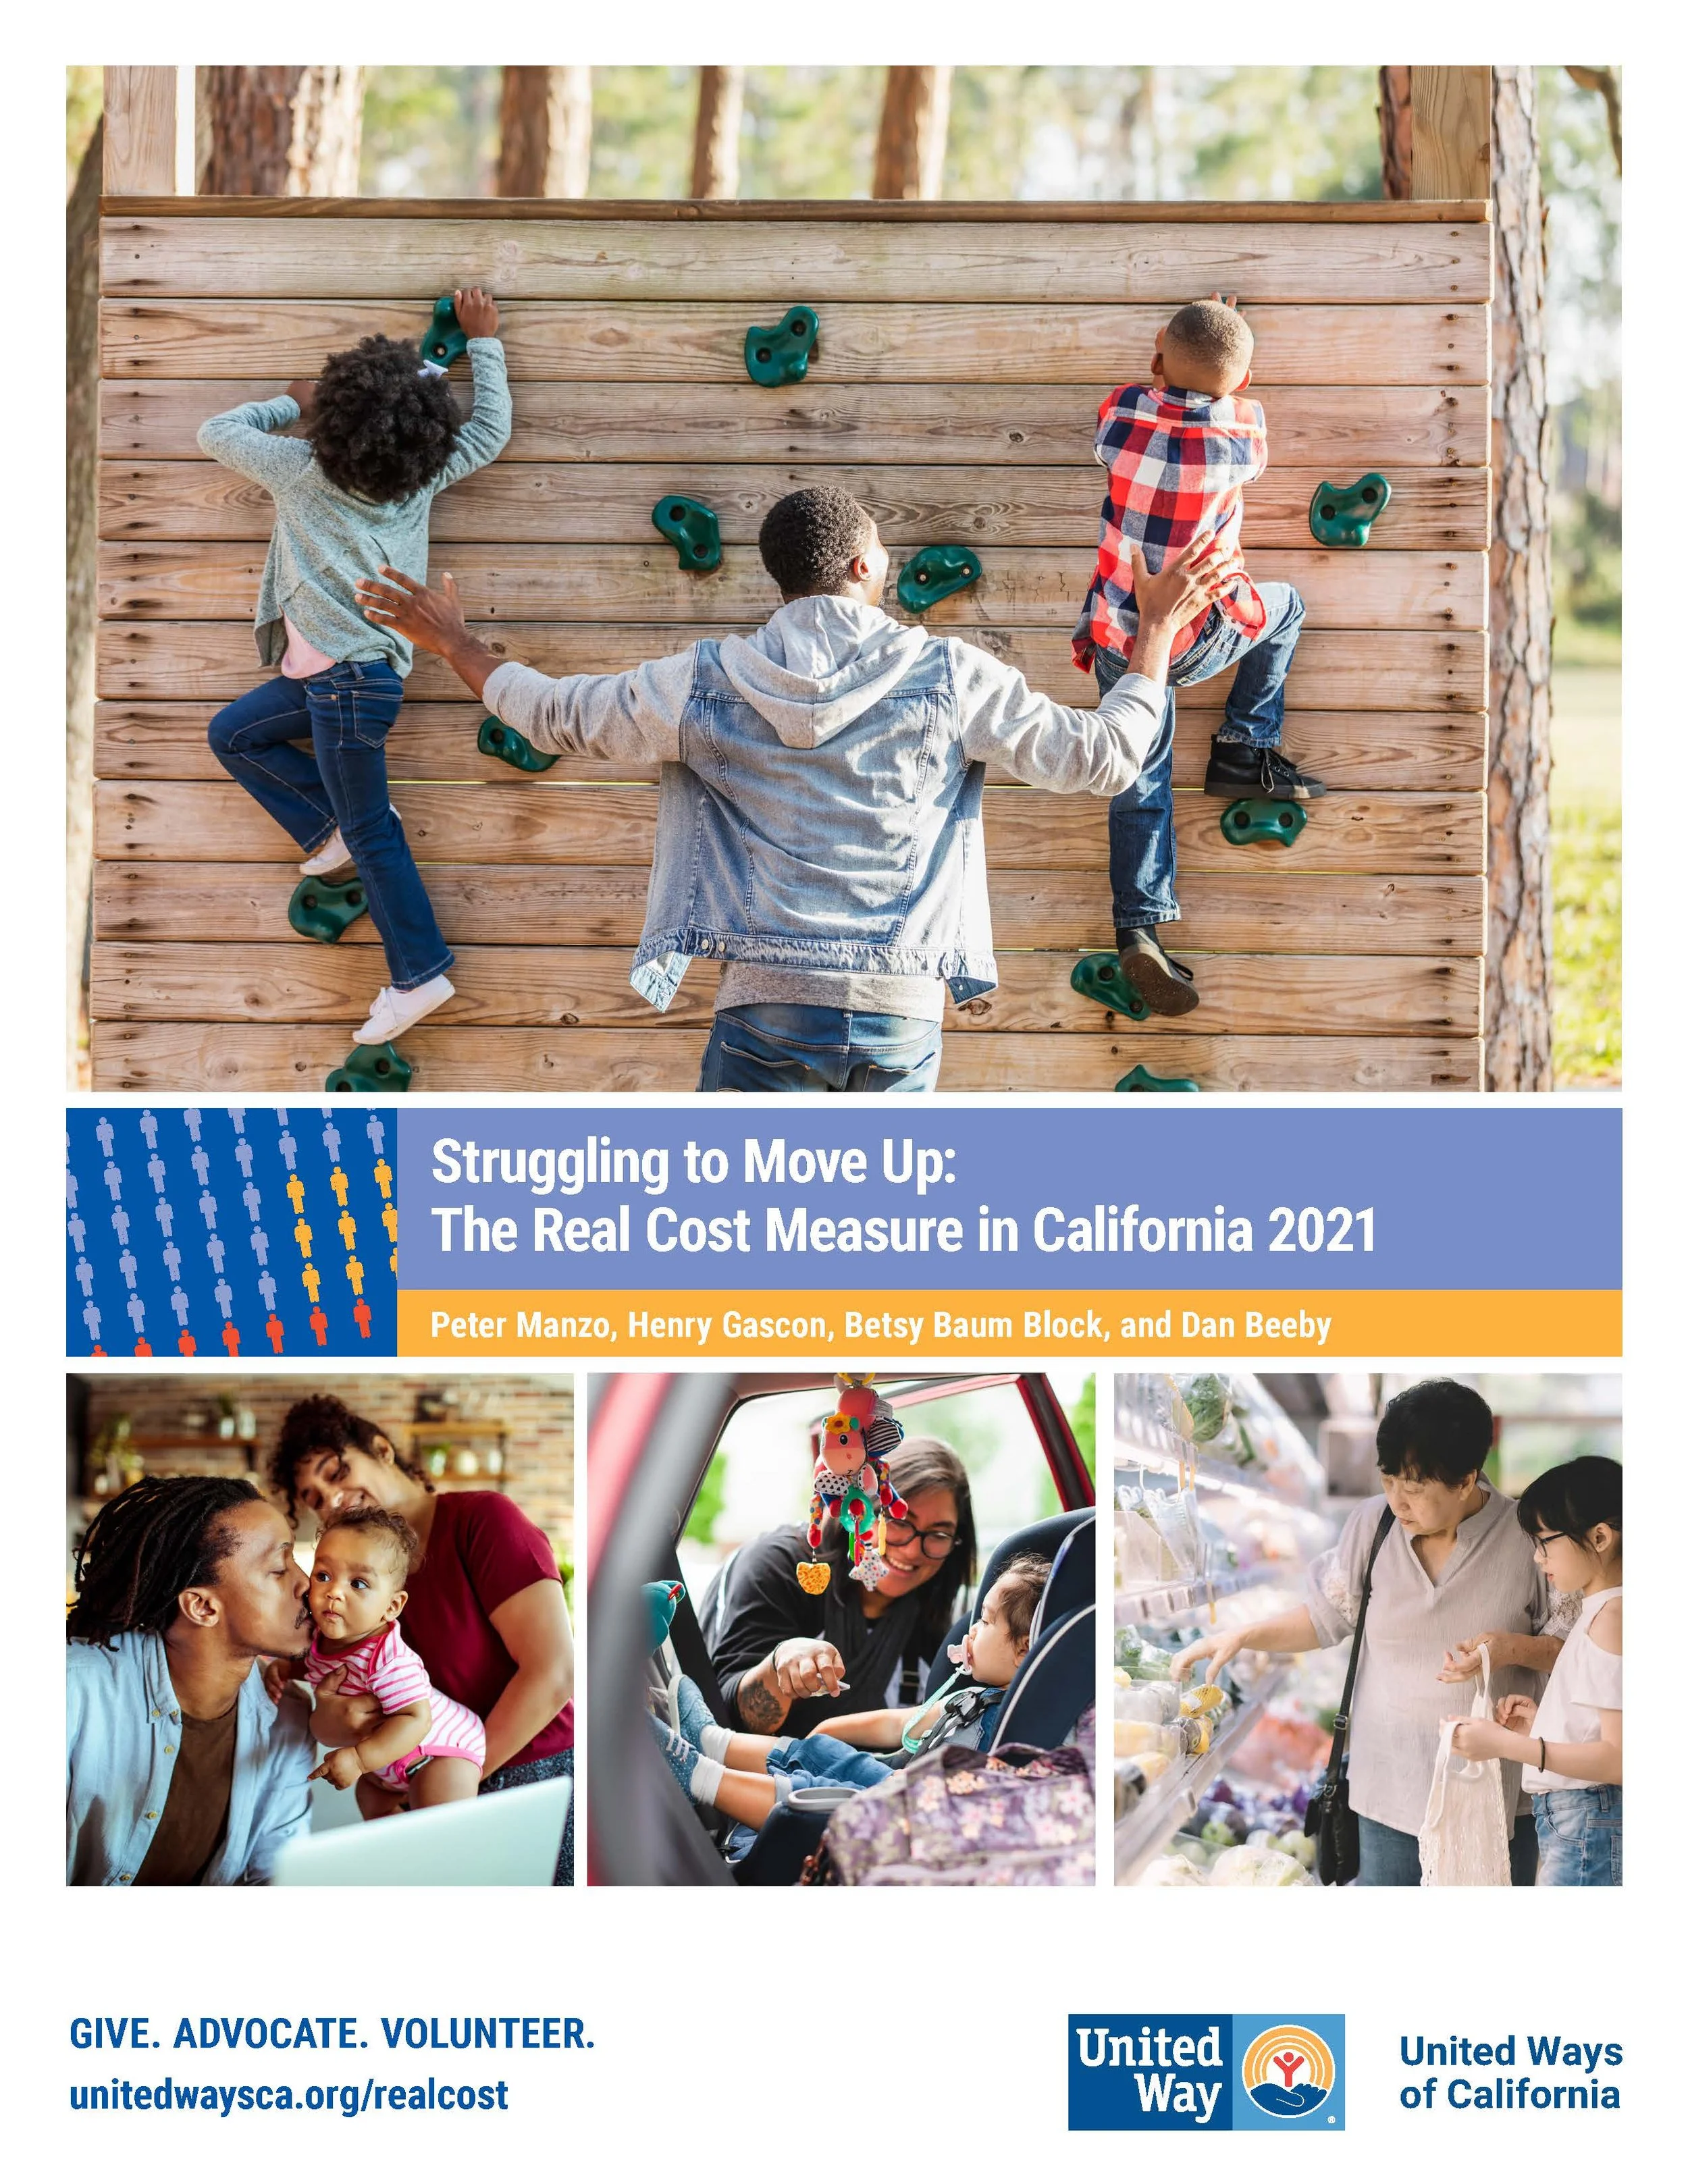
United Ways of California, in partnership with the 29 local United Ways throughout the state, is pleased to release Struggling to Move Up: The Real Cost Measure in California 2021, the fourth study on what it takes households to meet basic needs in California.
Unlike the official poverty measure which primarily accounts for the cost of food, the Real Cost Measure factors the costs of housing, health care, child care, transportation and other basic needs to reveal what it really costs to live in California. Some of the primary findings from The Real Cost Measure in California 2021 include:
Nearly one in three California households—over 3.5 million families (33%)—do not earn sufficient income to meet basic needs
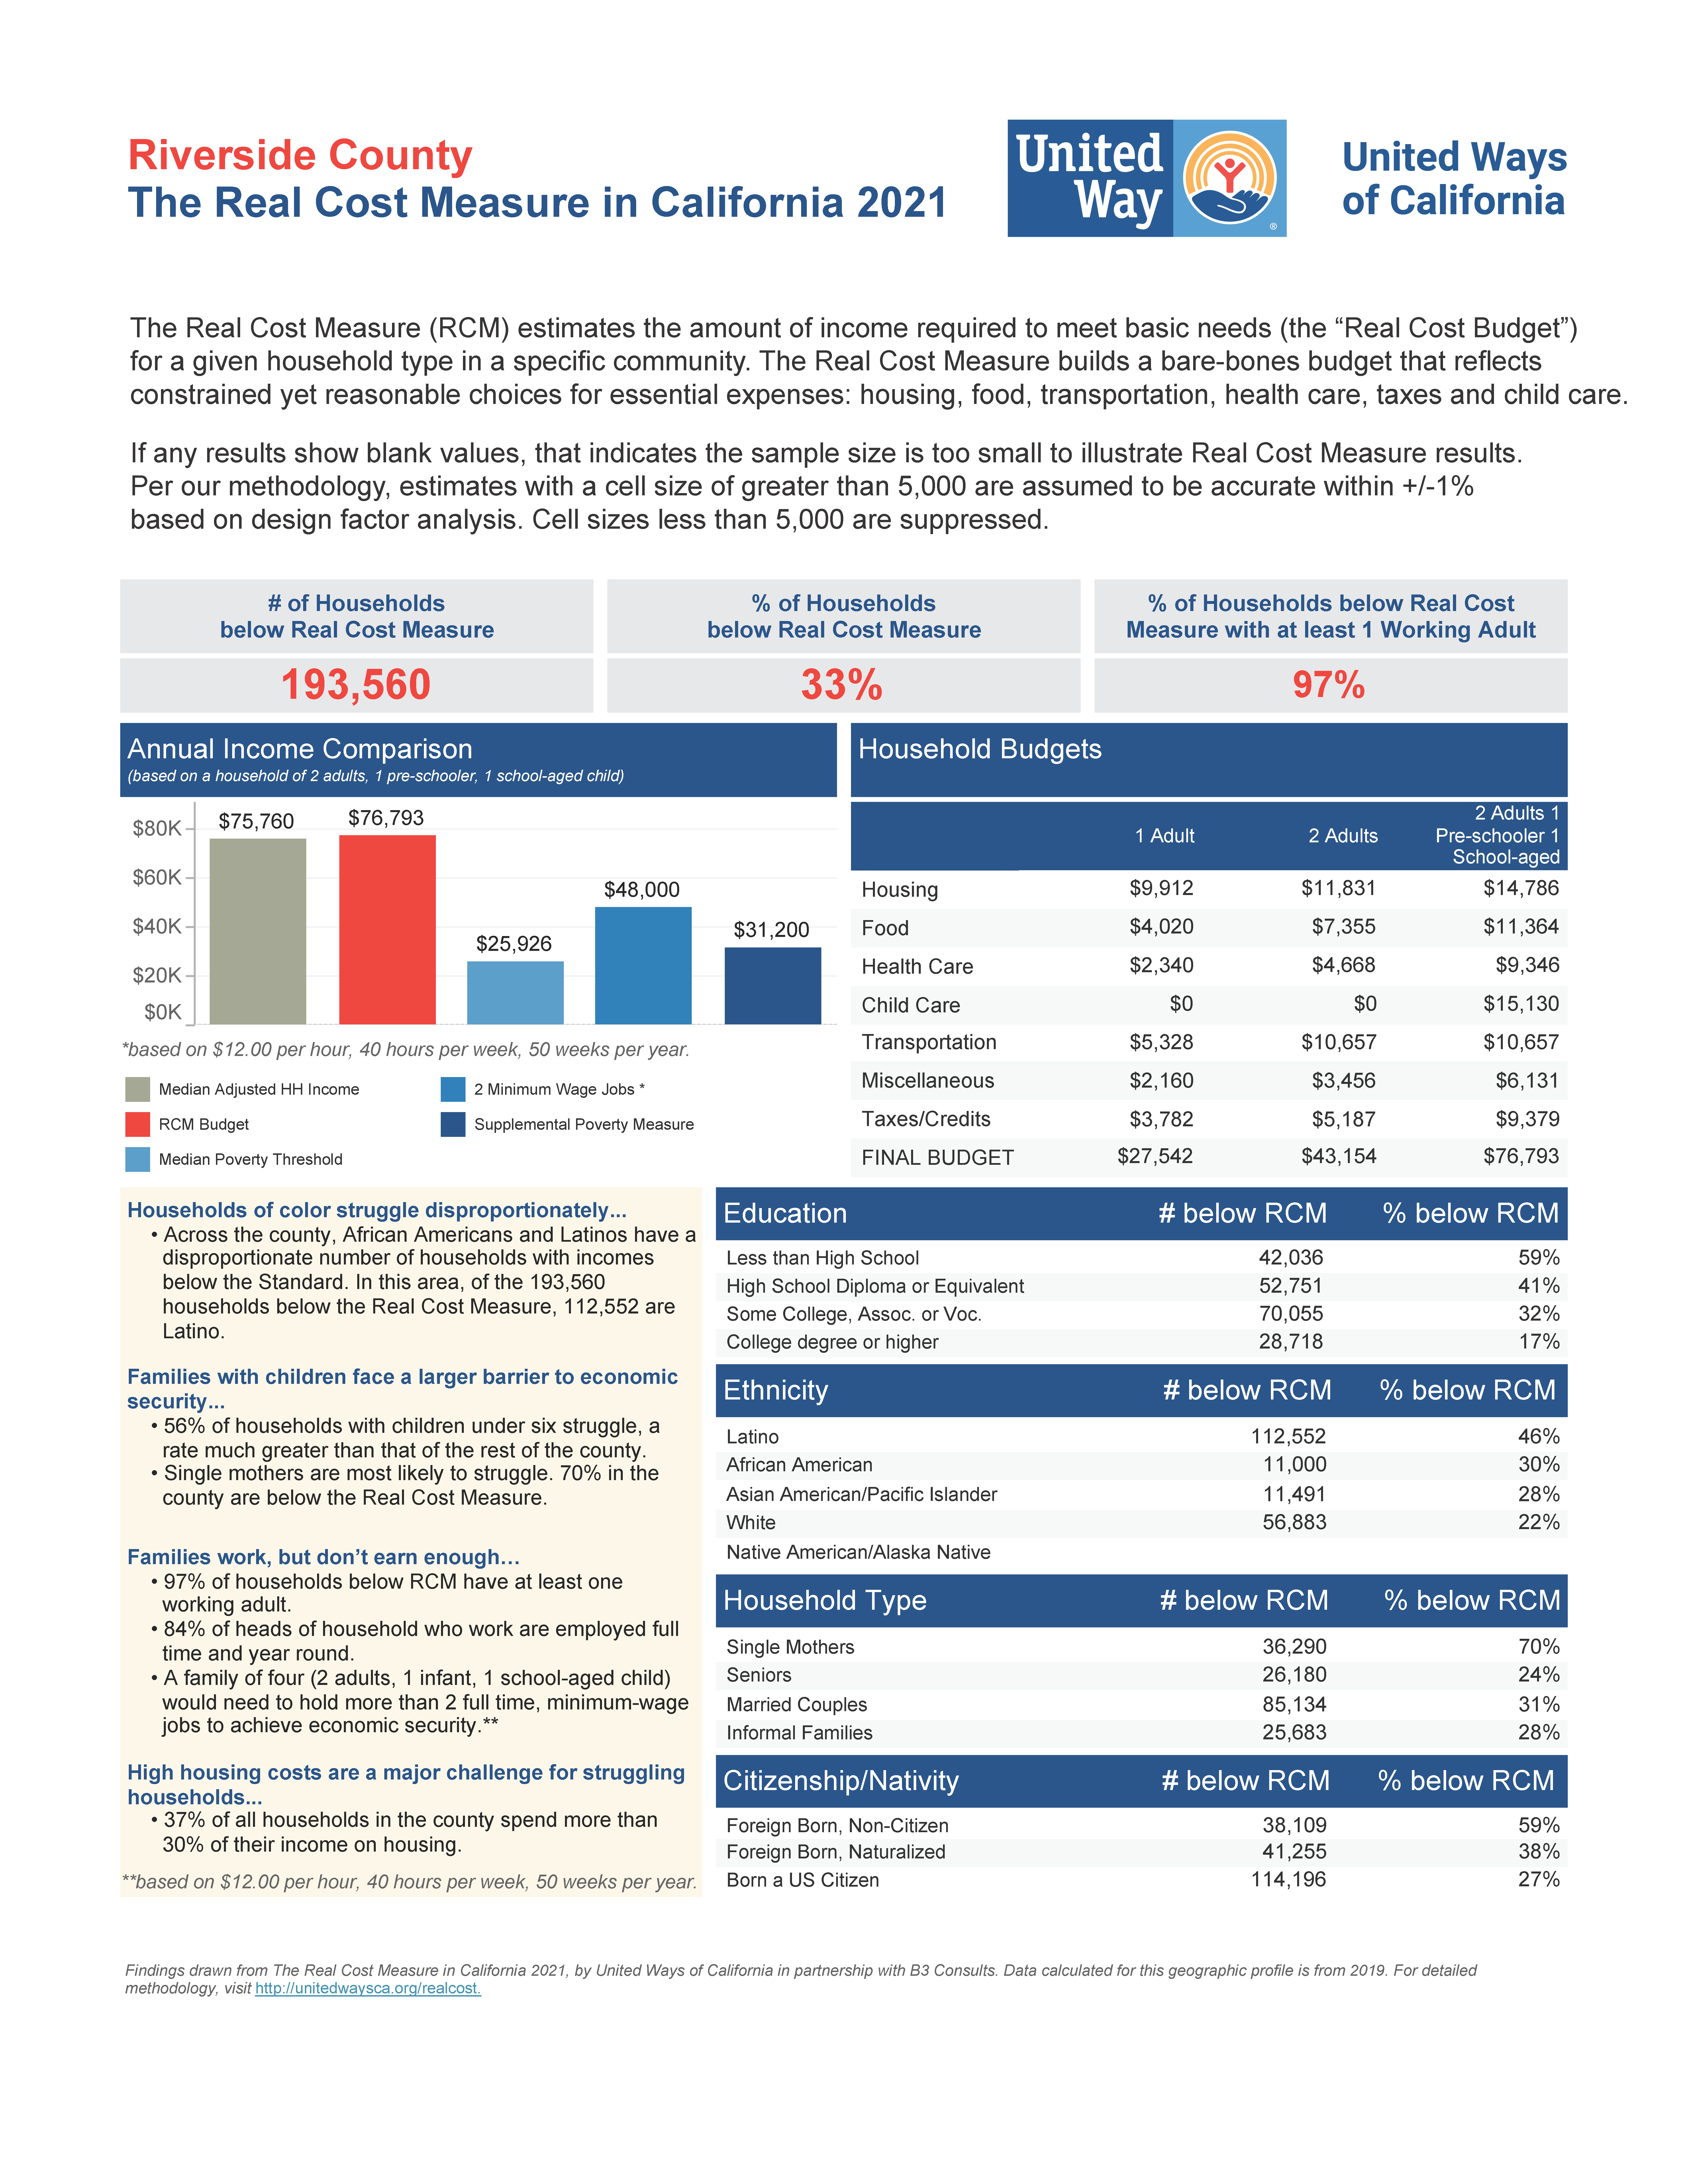
Struggling Households Work: Of the estimated 3.5 million households in California that fall below the Real Cost Measure, 97% have at least one working adult.
Child Care Costs Can Be Even More Expensive Than Housing for Many Families: In Fresno County, the annual cost of child care for a family with two adults, one preschooler, and one school-aged child can reach $14,429 versus $19,740 in Orange County.
Over Half of Young Children Live in Struggling Households: 54% of households in California with children younger than six-years-old fall below the Real Cost Measure.
Households of All Races Struggle, but Is Highest for Latino and Black Families: Over 1.7 million Latino households (or 52% of them) are estimated not to earn enough to get by, compared to over 1.06 million white households (21%); 481,618 Asian American households (28%); 259,516 Black households (41%); and 13,592 Native American/Alaska Native households (39%).
Less Education Results in Greater Struggles: Nearly 7 in 10 California households without a high school diploma or equivalent (68%) fall below the Real Cost Measure, compared to those with at least a high school diploma (47%), those with at least some college education (35%), and those with at least a bachelor’s degree (16%).
Single Mothers: Over 7 in 10 households led by single mothers in California (71%) fall below the Real Cost Measure.
Foreign-Born Households Have More Trouble Meeting Basic Needs: Thirty-six percent of households in California that are led by a person born outside the U.S. are below the Real Cost Measure, a figure which rises to 59% when someone without U.S. citizenship leads the household. Meanwhile, only 26% of households led by a person born in the U.S. earn income below the Real Cost Measure.
*Please note a previous version of this study did not properly account for child care costs in San Bernardino County. The study's findings have been finalized to reflect that change.
Real Cost Measure Dashboard
To view all Real Cost Measure data findings in a historical context between 2014 and 2019, we have built an interactive dashboard featuring one-year estimates in one interactive tool: the Real Cost Measure Dashboard. Here you can view what it takes for a family below the Real Cost Measure to make ends meet, additional county profiles, interactive maps, and more.

Household Budgets Calculator
Our household budgets calcuator contains approximately 1,600 budgets across California's 58 counties, up to 21 adults in a household. Here, you can select the county you live in, enter the ages of everyone in your household and determine the amount of income it takes to meet basic needs, the Real Cost Measure.

Interactive Maps
We are glad to offer interactive maps at the county and neighborhood level. These interactive maps give us the ability to view what the Real Cost Measure looks like throughout California, in addition to housing burden (the percentage of families pay at least 30% of their income on housing), and median household income.

State, Region, and County Profiles
Our new one-page state, region and county profiles provide rich information on how California communities fare with the Real Cost Measure. Here, you will find information on the number of households below the Real Cost Measure, who is struggling and what it takes for three different family types to reach the Real Cost Measure. (Click on the report profile to download .pdf document.)
State of California

Inland Empire

Riverside County
San Bernardino County

Previous Real Cost Measure Releases
United Ways of California has released three previous versions of the Real Cost Measure in California. Please note that in 2018, United Ways of California incorporated payroll taxes, child care tax credits and incorporated the Low Cost Food Plan by the U.S. Department of Agriculture for more robust household budget calculations. As a result, studies before 2019 will not reflect those changes. Click on the cover images below to learn more.
Struggling to Sta Afloat: 2019
Struggling to Stay Afloat: 2018

Struggling to Get By: 2015
